
Disclaimer: The analysis is the expression and assessment of investments right now. They cannot replace individual counseling. Always research and evaluate the investments you are considering based on your investment strategy, risk, and time horizon. Therefore, following the recommendations, you are responsible for any losses you may incur.
The year 2024 has ended, and much has happened in the stock market. Overvalued stocks have become even more expensive, and some speculative assets have increased significantly. Index funds continue to gain popularity, driving large-cap stocks to even higher levels. Combined with active funds that aim to outperform index funds (benchmarks) in the short term, more capital is being allocated to the largest companies in America. The S&P 500 is traded at a P/E multiple 30 (dependent on which sources you use), a key indicator of market sentiment and valuation. This high P/E ratio indicates strong confidence and expectations for good performance from the companies in the index; specifically, the ten largest companies account for over 30% of the total index. Most stocks have a P/E above 30, while Tesla's P/E is close to 120. This high P/E ratio suggests that the index may not be well-diversified for investors who are not well informed and have unrealistic expectations of continued high growth. Consequently, the index may be vulnerable to unforeseen events. Although the future is uncertain, the current valuation raises concerns about increasing risks to a level where I find little interest in investing in the S&P 500 as an investment product. With a median growth for the S&P 500 of 10% and a payout ratio of around 40%, the P/E should be a maximum of 26 if it is assumed that the index will perform as it has previously.
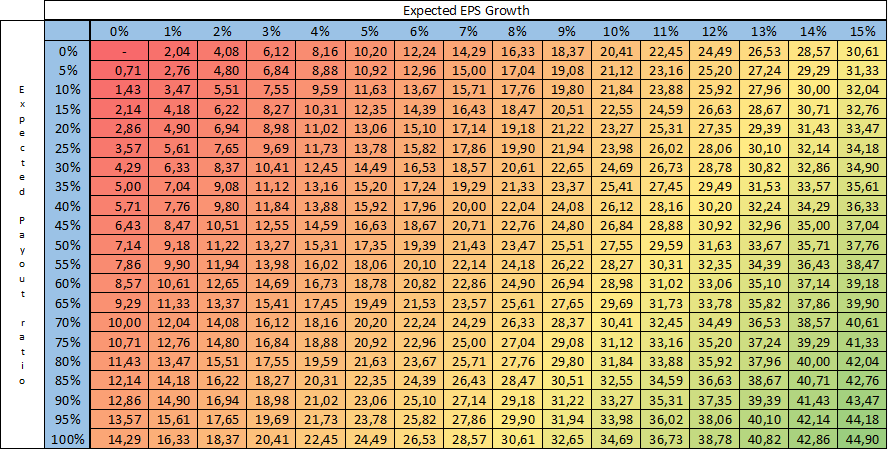
According to my calculations, the S&P 500 is slightly overpriced but shouldn't fall significantly. However, if growth slows down or it isn't possible to maintain the same dividend, the P/E ratio could drop. All this leads me to believe that the S&P 500 index is priced at its intrinsic value, and any unexpected downturn could result in a lower P/E and stock price. Nevertheless, it isn't likely to experience a specific surprise, and a higher P/E than it is now seems unrealistic. As there is no expansion in multiples, only growth appears reliable, and returns are unlikely to exceed the median growth rate of 10%.
On the other hand, the portfolio I allocate has a similar historical growth rate of 10%, but it is traded at an expected P/E ratio of 11, much lower than that of the S&P 500. Using the same valuation method as the table above, I have calculated a potential return on the portfolio of 105%. This possible return assumes that all investments forfeit their potential, which is an unrealistic assumption. By analyzing the company's growth, business model, and management quality, I estimate an expected return of approximately 62%. This expected return significantly exceeds what one can earn from the S&P 500.
However, the S&P 500, one of the benchmarks I compare to, has outperformed the portfolio I allocated by a significant margin this year. So, even when I assess the potential returns of my portfolio, the S&P 500 still manages to yield a greater return. I am questioning what is happening. Why is it that the S&P 500 is more expensive than the portfolio with similar growth and quality, but is much cheaper and has not performed better? The S&P 500 has provided approximately 25% compared to the 12% I have managed to acquire. While stock prices can't be predicted, many speculative assets have increased in value. Speculative assets are those whose fundamental quality and valuation do not make sense. For example, Bitcoin is a cryptocurrency that produces no cash flow, categorizing it as a speculative asset. Similarly, stocks such as Tesla and Nvidia have seen their prices driven up by expectations of future growth that may not materialize, meaning they would be considered speculative assets. Overall, today's stock market is driven by speculation about which stock will rise in price tomorrow. Of course, the likelihood of performing well in the coming years is not by investing in the S&P 500.
Transactions
In the second half of this year, there have been 16 transactions: eight stocks have been sold, and eight have been bought. The one marked in red represents the entire sold position, while the green indicates a new position in the portfolio. This means that only GN Store Nord has been added to the larger portfolio position, and the total number of stocks in the portfolio has decreased by one.
In the second half of this year, there have been 16 transactions: eight stocks have been sold, and eight have been bought. The one marked in red represents the entire sold position, while the green indicates a new position in the portfolio. This means that only GN Store Nord has been added to the larger portfolio position, and the total number of stocks in the portfolio has decreased by one.
|
Instrument |
Trade Date |
Exchange Description |
Event |
|
Protector Forsikring Asa |
27-12-2024 |
Oslo Børs/Oslo Stock Exchange |
Buy |
|
Zaptec AS |
23-12-2024 |
Oslo Børs/Oslo Stock Exchange |
Sell |
|
Evolution AB |
20-12-2024 |
NASDAQ OMX Stockholm |
Buy |
|
Betsson AB ser. B |
20-12-2024 |
NASDAQ OMX Stockholm |
Sell |
|
Gateley (Holdings) PLC |
17-12-2024 |
London Stock Exchange (SEAQ) |
Buy |
|
GN Store Nord A/S |
16-12-2024 |
NASDAQ OMX Copenhagen |
Buy |
|
Evolution AB |
13-12-2024 |
NASDAQ OMX Stockholm |
Buy |
|
Carriage Services Inc. |
06-12-2024 |
New York Stock Exchange |
Sell |
|
Netcompany Group A/S |
06-12-2024 |
NASDAQ OMX Copenhagen |
Sell |
|
Nathans Famous Inc. |
26-11-2024 |
NASDAQ |
Sell |
|
Samsonite International SA |
14-11-2024 |
Hong Kong Exchanges |
Buy |
|
Pandora A/S |
13-11-2024 |
NASDAQ OMX Copenhagen |
Sell |
|
Netcompany Group A/S |
13-11-2024 |
NASDAQ OMX Copenhagen |
Sell |
|
Verisign Inc. |
11-10-2024 |
NASDAQ |
Buy |
|
Nathans Famous Inc. |
19-08-2024 |
NASDAQ |
Buy |
|
Taiwan Semiconductor (TSMC) |
19-07-2024 |
New York Stock Exchange |
Sell |
Nathans Famous Inc. was bought and sold within a few months. The reason is that the stock price quickly grew to its fair value, and afterward, I sold it to achieve a return. The analysis indicates that the potential return was low, but the risk was also low, meaning that I concluded that the risk offers a reasonable return relative to investment risk. The stock price reached fair value for the other stock I sold, or I found something else in the industry more likely to provide a good return.
Overall, I'm working on the transactions. I prefer to lower the number of trades because there are costs associated with trading as frequently as I do now. However, finding a potentially better investment and ensuring that it is not replaced by a worse one is a cautious approach. Therefore, in my newly started investment adventure, the more investment cases I encounter, the more interesting they will seem, resulting in more trades, but always with a careful and considered approach.
Zaptec
One unique stock comes to mind when analyzing the stocks that have been underperforming. Since I purchased Zaptec, the stock has fallen by 57% and is, by a long shot, the worst return of my investment career. When I bought Zaptec's shares, the investment case was that electric vehicles were trending, and I saw that they required several chargers for one car- one at home, at work, in a shopping mall, or when visiting someone. Zaptec was using all its capital to expand into new markets because the most significant advantage the company could achieve was gaining a network and economies of scale. However, competition increased, and sales of electric vehicles slowed down, which led to uncertainty regarding Zaptec's revenue and profit. I thought sales would continue, and I didn't expect that Zaptec would face significant issues due to the trend of increasing electric vehicles. When this investment case changed, I needed to reanalyze the company. This led to my previous estimation being overly optimistic and the potential return not being as great as earlier analyses suggested. Therefore, the investment was sold at a significant loss. This experience taught me that trends can change rapidly, so I must be more defensive and consider the alternative possibilities. What could alter the trend, and what impact would it have on the company if it did? The company can still be a success, but I now find that less likely than before. Furthermore, companies with less proven track records shouldn’t constitute as large a part of my portfolio as Zaptec did.
Portfolio
In the first half of the year, there has been a slight change in the portfolio structure compared to its appearance during the same period last year. Firstly, the weight of the top stocks in the portfolio has shifted. Previously, the most prominent position was Olvi, accounting for 10,46% of the portfolio, the only stock exceeding 10%. Today, it ranks third-largest, surpassed by Evolution and Gateley. This shift makes the portfolio vulnerable if the expected value isn't realized. However, the overall structure of the portfolio has only changed slightly, so I wouldn’t say it is significantly riskier than before, even if it has become somewhat riskier. For a stock to be considered overweight compared to others in the portfolio, it must offer better returns relative to its risk and be less vulnerable to unforeseen events within its industry or the overall economy, as measured by its total exposure.
In the table below, you can see the portfolio's structure, the stock's quality score, the industry it operates in, and my expectations for how the stock will impact the portfolio's overall return. To calculate the expected impact on the portfolio, I multiplied the estimated return, based on its quality score and potential return, by how much it represents in the portfolio. This provides an estimated return of 62% and a P/E of 11,21, including the cash position of 4,37%. Therefore, the portfolio must be considered much cheaper than the S&P 500, and I believe the portfolio’s quality is only slightly worse than the index.
|
Official name |
Ticker symbol |
Cyclical / Defensive industry |
Industry |
Score (3-15) |
Price target (realistic) |
% of the portfolio |
Expect P/E |
Expected impact on portfolio |
|---|---|---|---|---|---|---|---|---|
|
Gateley (Holdings) Plc |
GTLY |
Between |
Professional & Commercial Services |
10 |
329,29 |
14,28% |
9,36 |
11,5% |
|
Evolution AB (publ) |
EVO |
Defensive |
Hotels & Entertainment Services |
12 |
1633,29 |
11,08% |
15,99 |
7,6% |
|
Olvi Oyj |
OLVAS |
Defensive |
Beverages |
10 |
71,20 |
9,08% |
7,75 |
7,5% |
|
Samsonite International SA |
1910 |
Cyclical |
Textiles & Apparel |
10 |
40,48 |
8,75% |
10,35 |
4,5% |
|
Broedrene A & O Johansen A/S |
AOJ B |
Cyclical |
Homebuilding & Construction Supplies |
9 |
236,96 |
8,50% |
5,52 |
8,5% |
|
GN Store Nord A/S |
GN |
Between |
Computers, Phones & Household Electronics |
9 |
293,71 |
8,02% |
10,89 |
4,7% |
|
New Wave Group AB |
NEWA B |
Cyclical |
Textiles & Apparel |
10 |
229,79 |
7,59% |
7,96 |
6,0% |
|
Protector Forsikring ASA |
PROT |
Defensive |
Insurance |
11 |
495,88 |
7,30% |
14,15 |
3,6% |
|
Fractal Gaming Group AB |
FRACTL |
Cyclical |
Computers, Phones & Household Electronics |
10 |
55,46 |
6,48% |
11,04 |
2,7% |
|
VERISIGN, INC. |
VRSN |
Defensive |
Software & IT Services |
13 |
266,35 |
5,55% |
26,25 |
1,4% |
|
Note AB (publ) |
NOTE |
Cyclical |
Semiconductors & Semiconductor Equipment |
10 |
250,62 |
4,44% |
14,61 |
1,8% |
|
Careium AB (publ) |
CARE |
Defensive |
Professional & Commercial Services |
11 |
48,43 |
4,56% |
12,94 |
1,8% |
The portfolio’s vulnerabilities within its industry or the overall economy is analyzed by the portfolio's total exposure to industry and level of cyclicality. The table below displays the portfolio exposure, with Professional & Commercial Services being the most weighted, followed by Textiles & Apparel. Professional & Commercial Services and Textiles & Apparel are generally regarded as cyclical sectors, and widespread panic can lead to declining stock prices if institutions collectively sell these stocks. However, it is not feasible to have exposure to every industry without over-diversifying and investing in stocks beyond your circle of competence. I lack much expertise in banking or electric utilities, and I discovered other industries to be more interesting for investment due to their potentially low valuations. Overall, I found the allocation among industries to be well diversified. Still, there may be too much focus on private customer behavior, which I need to analyze in the coming year.
|
Industry |
Portfolio exposure |
|
Professional & Commercial Services |
19,70% |
|
Textiles & Apparel |
17,09% |
|
Computers, Phones & Household Electronics |
15,16% |
|
Hotels & Entertainment Services |
11,59% |
|
Beverages |
9,49% |
|
Homebuilding & Construction Supplies |
8,89% |
|
Insurance |
7,63% |
|
Software & IT Services |
5,80% |
|
Semiconductors & Semiconductor Equipment |
4,64% |
The cyclical diversification among the three factors is nearly equal. Therefore, there isn't anything further to add, as it maintains a good balance between benefiting from economic growth and hedging against a slowdown. Nonetheless, the portfolio will likely experience some declines if the stock market drops, since it is primarily focused on stocks. Additionally, it is more heavily weighted towards individual stocks than other funds, which means the portfolio remains risk-averse to events or incorrect assumptions affecting the overall return.
|
Cyclical / Defensive industry |
% of the portfolio |
|
Cyclical |
37,39% |
|
Between |
23,32% |
|
Defensive |
39,29% |
Performance
As mentioned, the portfolio hasn't outperformed the S&P 500 index this year, resulting in temporary underperformance. However, this underperformance could be due to the portfolio's low weight in American stocks, which instead focuses on European stocks. I have found stocks with high-quality elements for a much lower valuation than the stocks in America. The only stock I own in America is VeriSign, which has an incredible moat, allowing it to command a higher multiple than others.
Still, while I haven't outperformed the S&P 500, I have significantly outperformed OMX 25 (Den) and EU 50 (Europe).
|
Year |
Portfolio |
SP500 |
OMX C25 |
EU 50 |
|
2023 |
27,10% |
23,96% |
6,69% |
22,45% |
|
2024 |
12,11% |
23,53% |
-2,50% |
7,29% |
|
Average return (2 years) |
19,61% |
23,75% |
2,10% |
14,87% |
However, I have considered what I should do to achieve a greater return than the benchmark at all costs. I have considered how people find someone irrelevant if you can't outperform an index that anyone can buy to obtain a better return. But in the end, I'm not willing to take on more risk than the market is prepared to bear. Therefore, when the market adds risk and is less risk-averse because of high expectations for an asset, where fundamentals and valuation become distorted, I stay away and instead try to find stocks that reflect the opposite beliefs of the market. This may result in some years of underperformance, but in the long run, if I act prudently, the portfolio should outperform the benchmark by a margin. I aim for a minimum return of 10%, but I strive for an annual gain above 20%. In this regard, an average return of 19,61% is more than acceptable as I don't take on more risks than the benchmark.
Looking forward
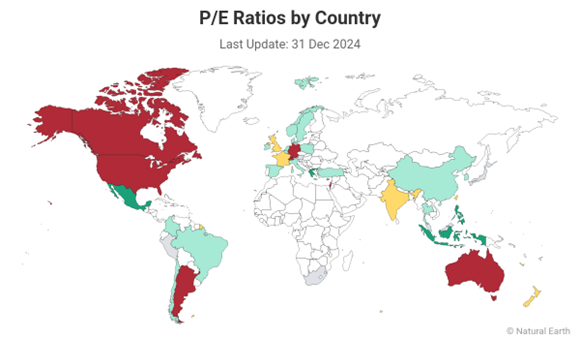
2025 should be no different from other years. While the S & P 500 may be an expensive investment product, it is still possible to find undervalued stocks by exploring areas that others overlook and have perhaps underperformed the market for some time.
The image below shows the index presented in each country and how they are valued compared to an average P/E over the last 5 years. Countries such as Mexico, Denmark, Sweden, and China are highlighted in green, indicating they may be undervalued compared to their historical values. This does not mean those indexes are a buy, but they provide a good opportunity to search for undervalued stocks or index funds with low expectations.
Furthermore, I will continue searching for undervalued stocks wherever they appear, as long as I can purchase them through my brokerage. I'm not attempting to speculate on which stock price will increase. Instead, I hold a stock portfolio and wait for its intrinsic value to persist. Therefore, I strive to identify stocks with long-term compounding that outperform their peers, which means they will, over time, generate additional returns. Thus, time and patience will benefit the long-term investor, but only a combination of growth and valuation will yield extraordinary returns.
Recently, many investors have been following the trend of the hottest stocks, believing that new technological innovations like crypto and AI will transform the world and that today’s market leaders will be the future winners. While I cannot predict the industry's performance, companies with high valuations will attract other entrepreneurs looking to create the same wealth. Therefore, more companies will try to gain market shares from today's market leaders. Remember that while the car industry changed how we transport materials instead of horses, many car companies went bankrupt, and it would have been nearly impossible to predict who would be the actual winner. Later, the same situation occurred during the dot-com bubble. Many Internet stocks went bankrupt, even when the Internet changed how we communicated and collected information. The same holds when trying to figure out how AI will impact our daily lives, but the current winner isn’t guaranteed to be tomorrow’s winner.
Therefore, I attempted to find stocks unlikely to be disrupted in the future (one reason Zaptec was sold) and industries with low innovation. These could include food-related companies because people need food and alternatives can’t replace it. The future is uncertain and, in some instances, quite unpredictable. While I would love to know which stock will change the world, I also want to steer clear of companies that might go bankrupt, as investors could lose all their capital.
Conclusion
In conclusion, the stock market at the end of 2024 presents a complex landscape where the S&P 500 appears overvalued, especially given its high P/E ratios concerning expected growth rates. Despite the ongoing popularity of index funds and strong performance from leading companies, significant risks are associated with such valuations, particularly if growth expectations fail to materialize.
While generating lower returns than the S&P 500 this year, my portfolio maintains a more favorable P/E ratio and potential for improvement based on a thorough analysis of company fundamentals. The disconnect between market valuation and intrinsic value raises questions about the sustainability of current stock prices, which are primarily driven by speculation rather than solid fundamentals.
Overall, while the S&P 500 has outperformed my investments in the short term, the risks associated with overvaluation and speculative bubbles could lead to precarious outcomes in the future. Therefore, a cautious approach to investing in the S&P 500 is warranted, and a more in-depth analysis of portfolio selections may yield better long-term returns.
Comments