
Disclaimer: The analysis is the expression and assessment of investments right now. They cannot replace individual counseling. Always research and evaluate the investments you are considering based on your investment strategy, risk, and time horizon. Therefore, following the recommendations, you are responsible for any losses you may incur.
The analysis will provide estimates and that will be some unknown events there isn't accounted for, and it's important to remember that the investment is not a guaranteed return. The analysis of the company's fundamentals will be divided into four segments: growth, business management, and other considerations such as the cyclicality of the company.
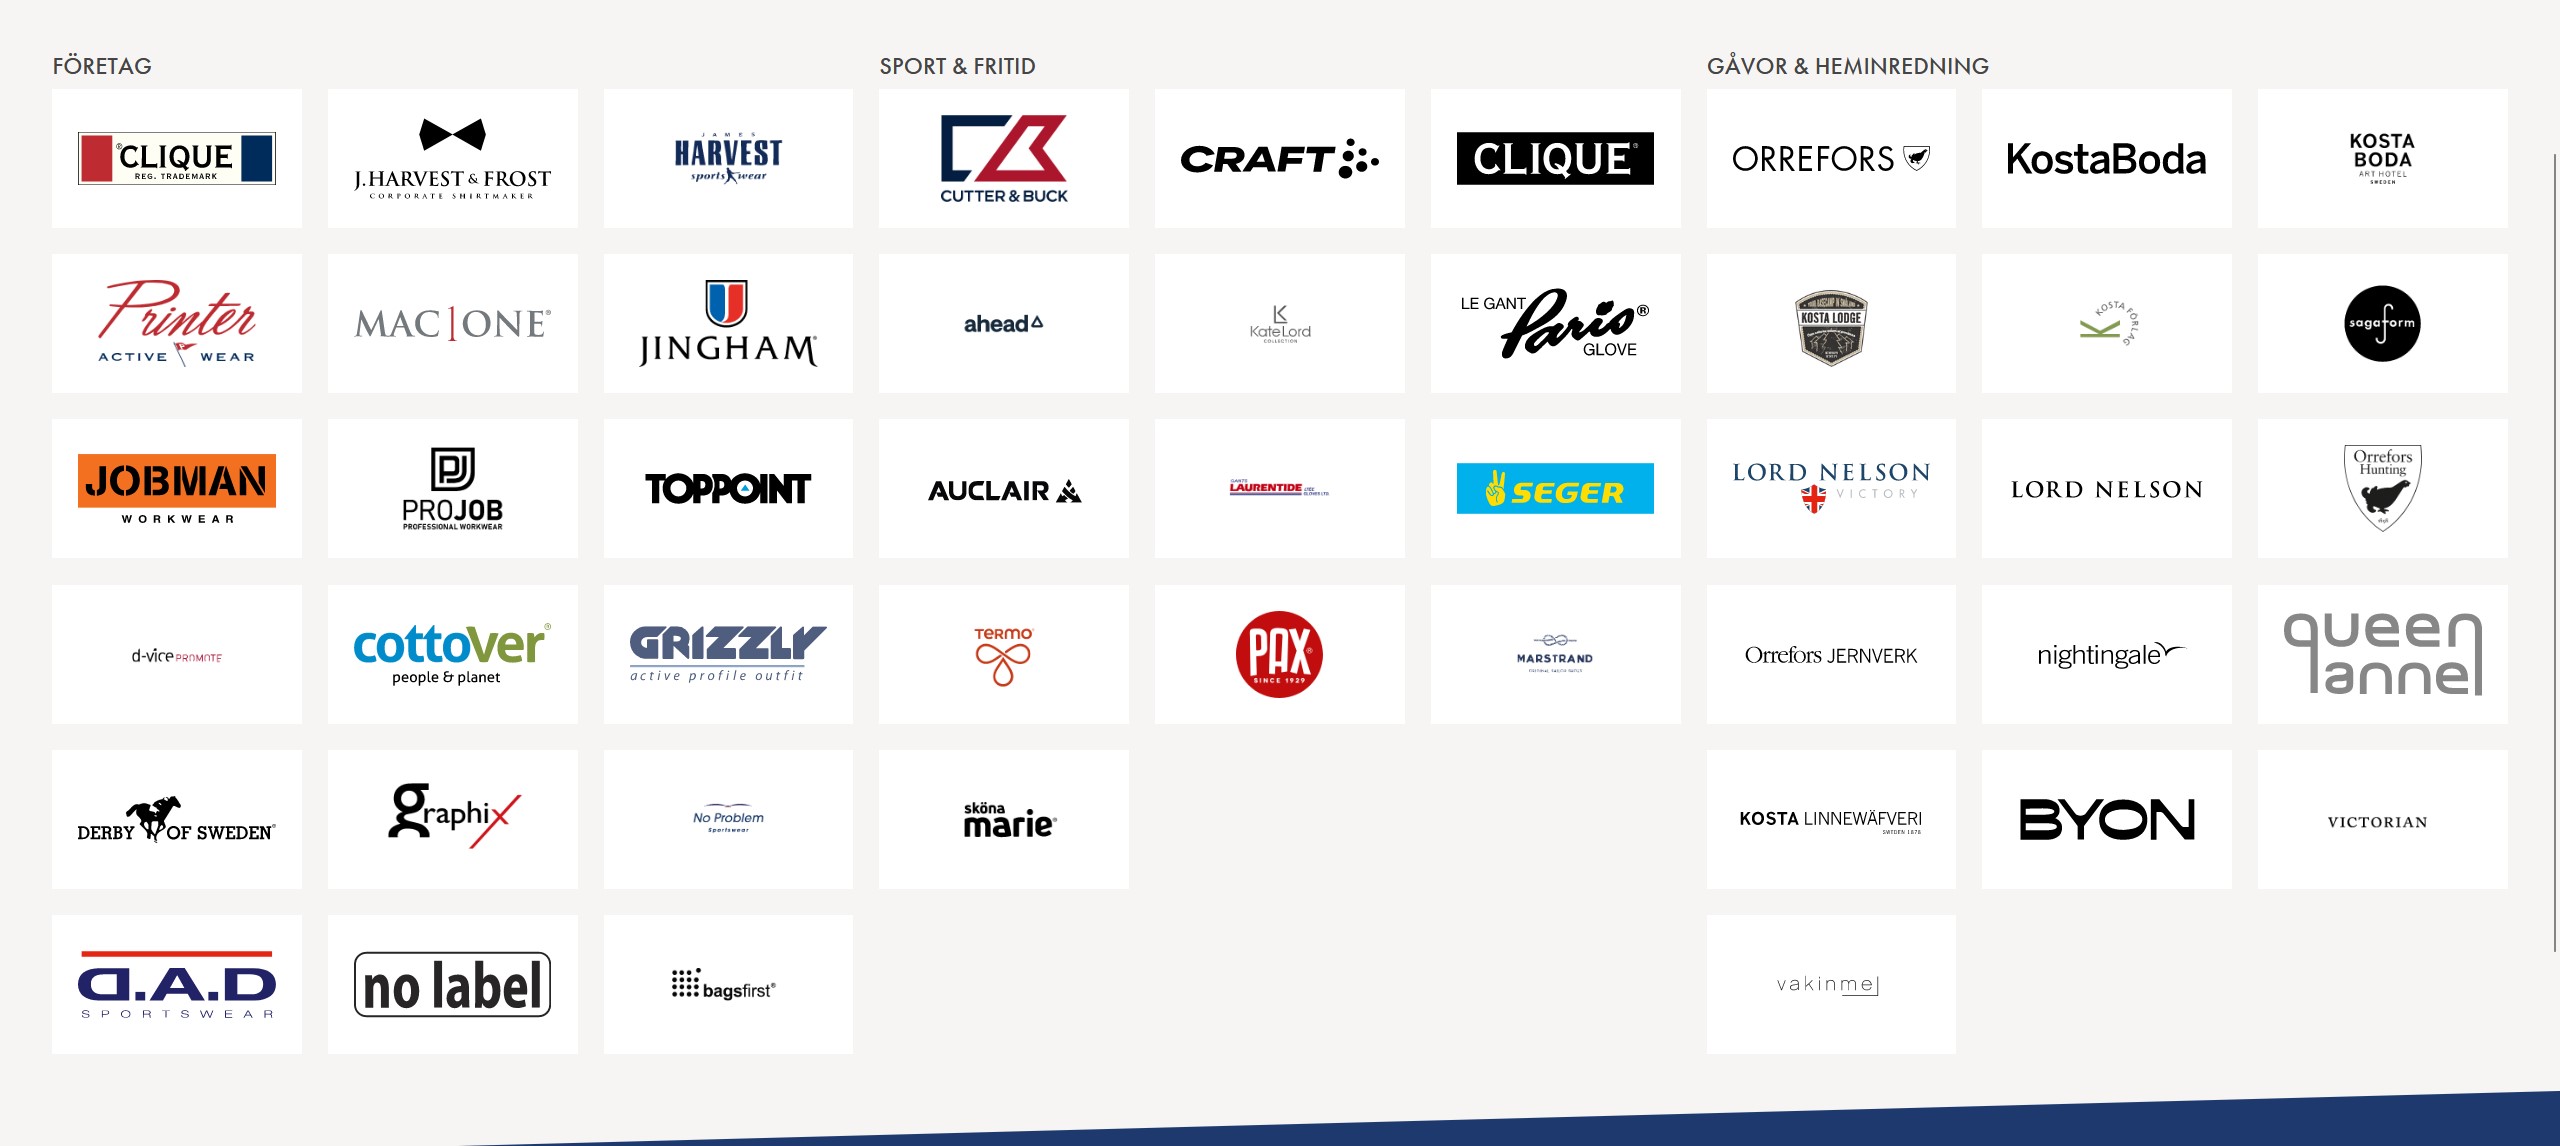
New Wave Group (Newa) is a conglomerate of companies that designs, acquires, and develops brands. The sales channels are divided between the promo market (61% of revenue) and the retail market (39% of revenue). Newa operates in three segments: Corporate (47% of revenue), Sport & Leisure (43% of revenue), and Gift & Home Furnishings (10% of revenue). They own several brands, including Clique, Harvest, Jobman, Craft, Cutter & Buck, and Orrefors.
In terms of geographical sales, the company derives 24% of its revenue from the USA, 23% from Sweden, 19% from Central Europe, 13% from Southern Europe, 12% from Nordic Countries excluding Sweden, and 9% from other countries.
Financial
In terms of its financial statement, Newa can be succinctly summarized as largely acceptable from a historical standpoint. The organization's growth trajectory is upward, with margins continuing to improve, a healthy balance maintained, and a consistent distribution of capital to shareholders via dividends.
|
SEKmm |
2014 |
2015 |
2016 |
2017 |
2018 |
2019 |
2020 |
2021 |
2022 |
2023 |
Avg. Growth |
|
Revenues |
4.274 |
4.965 |
5.237 |
5.597 |
6.291 |
6.904 |
6.099 |
6.719 |
8.844 |
9.513 |
9,3% |
|
Operating Income |
258 |
233 |
389 |
464 |
472 |
536 |
473 |
942 |
1.484 |
1.628 |
22,7% |
|
Net Income |
176 |
144 |
276 |
354 |
363 |
376 |
366 |
760 |
1.169 |
1.119 |
22,8% |
|
Diluted EPS |
1,33 |
1,08 |
2,08 |
2,67 |
2,74 |
2,83 |
2,75 |
5,73 |
8,81 |
8,43 |
22,8% |
|
Dividends Per Share |
0,50 |
0,50 |
0,68 |
0,85 |
1,00 |
|
2,00 |
2,13 |
3,25 |
3,50 |
24,1% |
|
Payout Ratio |
38% |
46% |
33% |
32% |
36% |
0% |
73% |
37% |
37% |
42% |
1,1% |
|
Diluted Shares Outstanding |
132,69 |
132,96 |
132,69 |
132,69 |
132,69 |
132,69 |
132,69 |
132,69 |
132,69 |
132,69 |
0,0% |
|
|
|
|
|
|
|
|
|
|
|
|
|
|
Balance Sheet Total |
5.237 |
5.479 |
5.824 |
5.953 |
7.061 |
8.394 |
7.217 |
7.661 |
10.944 |
10.739 |
8,3% |
|
Total Equity |
2.405 |
2.514 |
2.817 |
3.029 |
3.434 |
3.771 |
3.856 |
4.568 |
5.891 |
6.461 |
11,6% |
|
Equity Ratio |
45,9% |
45,9% |
48,4% |
50,9% |
48,6% |
44,9% |
53,4% |
59,6% |
53,8% |
60,2% |
3,0% |
|
Total Debt / EBITDA |
6,72 |
7,23 |
4,41 |
3,48 |
3,94 |
4,40 |
3,06 |
1,20 |
1,59 |
1,27 |
-16,9% |
|
Operating Margin |
6,0% |
4,7% |
7,4% |
8,3% |
7,5% |
7,8% |
7,8% |
14,0% |
16,8% |
17,1% |
12,3% |
|
Net Income Margin |
4,1% |
2,9% |
5,3% |
6,3% |
5,8% |
5,4% |
6,0% |
11,3% |
13,2% |
11,8% |
12,4% |
|
Return on investment (ROI) |
4,9% |
4,3% |
6,7% |
7,8% |
6,7% |
6,4% |
6,6% |
12,3% |
13,6% |
15,2% |
13,3% |
Growth - Quality score 2 out of 5
There is no significant trend that Newa can benefit from at the moment. However, the increasing GDP and inflation are prompting people to spend money on various things like clothing. Several companies are supporting the cause of not burning clothes and producing quality products that can last longer, due to the growing concern for a healthier climate. According to Newa's CEO, the company produces timeless products that can be used for a long time, and hence, Newa burns fewer clothes than its competitors. Newa has a diversified brand portfolio of sports and work attire, and these categories are the main drivers of revenue growth.
However, fashion trends change frequently, and Wave has chosen a strategy to focus on selling clothes in the job and training segment, which is a market with many competitors and options for customers. Moreover, creators/influencers/celebrities can now easily create their brands and use themselves as a marketing channel to reach their audience. This makes the industry more competitive and challenging to sustain profitability in the long run. Wave is focused on expanding the business, but due to different views across countries, there is no guarantee of reaching customers with larger sales or profitability.
Business - Quality score 3 out of 5
Newa's strategy is to introduce new brands and develop concepts in new markets. Newa aims to integrate the brands in its portfolio through acquisitions to benefit from the synergy effect. Specialized brands and better-cost production due to a larger scale effect can help Newa achieve this. The organization's structure is decentralized, allowing managers to make decisions faster based on their knowledge of the brand and its position in the market. The competitive advantage of many of their brands is to be niche locally and create a moat through customers' preferences. This has resulted in increased revenue over time without affecting Newa's equity ratio
Newa has a significantly lower inventory turnover compared to its peers. As of 2021, Newa's inventory constitutes 2.937,60 SEK out of 5.346,80 SEK in 2023, which may cause some liquidity issues in the short term. However, the quick ratio is still around 1, indicating financial strength in the short term. If it falls below 1, it could become an issue. Newa believes that the collection of inventory includes timeless basic products that customers will still demand in the future, and the risk of obsolescence is low.
The competition in the industry is intense, with Newa competing against bigger companies while new companies are entering the market. This gives customers greater opportunities to switch between brands.
Management - Quality score 4 out of 5
The CEO of Newa, Torsten Jansson, holds a significant position in A-shares, and he is also the third largest holder of B-shares. This indicates that he has a strong interest in increasing the value of the company in the long term. Additionally, the CEO has been with Newa for 13.9 years, and the CFO, Lars Jönsson, has been with the company for 16.3 years. This is a good indicator that the management team understands the value of the company and how to increase revenue over time. Management has also continued to buy shares in Newa, which shows that they believe the company will do well at current price levels. Furthermore, the ownership structure tells us that the management has greater control over the company.
There are some members of the management who are getting older and may need to retire soon. For instance, the CEO is 61 years old, and it wouldn't be surprising if he decides to retire within the next decade. This could pose a risk if the incoming management doesn't have the same skills as the current team. However, the company's structure is decentralized, which makes it less risky for key members to leave the organization.
Other thoughts
Newa's financial target is to achieve between 5-10% organic growth per year throughout one business cycle. With acquisitions, the target is between 10-20% per year. The operating margin target is around 20%. To achieve this target, Newa plans to expand its products to new markets and acquire other brands. The solvency ratio is solid, and Newa has expressed interest in more acquisitions. The dividend payout ratio has averaged around 37%. Newa's brand portfolio is diversified and not dependent on a single brand or type of clothing. However, many brands are closely related, which means that one brand can take market share from another brand in the portfolio.
Newa operates in a cyclical industry, so its revenue and profit may be affected if there is a macroeconomic slowdown. It is normal in the industry to have a larger inventory than the sales have peaked and try to sell products by discount when the economy is slowing down. This results in less profit from products. Another risk at Wave is the low inventory turnover compared to competitors. Competitors have twice as high turnover. Wave has not slowed in revenue, indicating a larger inventory than the normal ratio to revenue. Newa's management believes that their inventory/products are more timeless, which can explain their view on a large inventory.
Valuation
When looking at the valuation of a company, I find the P/E (price-to-earnings) ratio to be a better indicator of the market's belief in how the company will perform. The 10-year historical average P/E ratio is around 12,5, which is lower than the current P/E ratio of around 14,7. This suggests that the market has higher expectations for the company's EPS (earnings per share) growth than before, which also means the stock has a greater risk of disappointing shareholders. However, the stock is still traded at a lower level than the global index, which is around 21. So, there is still a lot of potential for multiple expansion before it reaches an average belief of delivering the same growth expectation as other stocks.
The company's market capitalization is relatively low compared to other stocks, which makes bigger investment players unwilling to invest in the company. This, in turn, makes the stock price more volatile and lowers its valuation.
Regarding the current P/E ratio compared to the growth and margin expectations from the management, the growth target is between 10 and 20% per year, of which between 5 and 10% is organic growth, with a 20% operating margin (previously 15%). There isn't a specific date when this will happen because some of the target depends on acquisition opportunities.
To summarize, there are three scenarios: Worst, Realistic, and Optimistic. There is definitely some potential for a significant return as a shareholder, but it also comes with risks if the strategy doesn't go as planned.
|
Valuation |
|||
|
New Wave Group AB (XSTO:NEWA B) |
|||
|
Return requirements |
7,0% |
||
|
Current/Expected Revenue (MM) |
9.592 |
||
|
Price to sales |
1,21 |
||
|
Price to earning |
14,71 |
||
|
Current stock price |
123,46 |
||
|
Buying stock price |
137,15 |
||
|
Scenario |
Worst |
Realistic |
Optimistic |
|
Expected growth |
3,6% |
7,1% |
15,0% |
|
Expected payout rate |
30% |
30% |
30% |
|
Earning power |
0,81 |
1,31 |
2,44 |
|
Expected margin |
6,0% |
15% |
15% |
|
Expected P/E |
20,11 |
8,04 |
|
|
Expected EPS |
6,14 |
15,35 |
15,35 |
|
P/E (Fair) |
11,63 |
18,78 |
34,90 |
|
Price target (12 months) |
71 |
288 |
536 |
|
Price target in % |
-48% |
110% |
291% |
|
Price target in % (current price) |
-42% |
133% |
334% |
New Wave Group is an investment opportunity with potential risks and benefits. The company has shown an upward growth trajectory with improving margins and a healthy balance sheet. It has diversified brand portfolios in sports and work attire, which are the main drivers of revenue growth. However, the competition in the industry is intense, and the low inventory turnover ratio may cause some liquidity issues in the short term. While New Wave Group is not a guaranteed return investment, it has a strong management team and strategic goals. Overall, the investment opportunity is promising, but it requires a degree of patience.
If you like to go deeper New Wave had recently a capital markets day, where the management went into more detail on the business.
Company Information
Name: New Wave AB
Exchange Code: NEWA
Market Value $: 1.585,38
Sector & Industry
Sector: Consumer Discretionary
Industry: Textiles, Apparel and Luxury Goods
Price Information Price:
Price Target: 288
P/E: 14,7
Moat: Medium
Comments